| Color
Spaces |
These are two examples
of technical illustrations I created in LightWave
using shaders and model building programs I wrote. I've added a brief explanation of what
each of them shows, and I mention how I created them, but the main reason for displaying
them here isn't educational. I just think they look cool. |
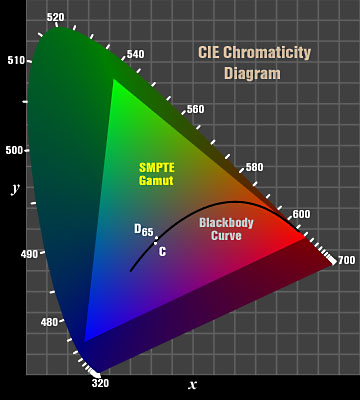 The chromaticity diagram is a 2D slice through the 3D
color space defined by the Commission Internationale de l'Éclairage (CIE) in 1931. The chromaticity diagram is a 2D slice through the 3D
color space defined by the Commission Internationale de l'Éclairage (CIE) in 1931.The standard RGB primaries used in NTSC, PAL/SECAM, SMPTE and other color systems for video are defined by chromaticity coordinates. They form the vertices of the gamut triangle in the diagram. Colors outside that triangle can't be represented as a combination of the primaries. Pure spectral colors run along the horseshoe-shaped boundary (the numbers are wavelengths in nanometers). The non-spectral purples are along the line connecting the red and blue ends of the horseshoe. Sources:
|
How it was done Standard tables and formulas were used to find vertex coordinates for the tickmarks, blackbody curve and horseshoe shape. Each object was written initially as a VideoScape .geo file and loaded into Modeler using my .geo import plug-in. The colors in the diagram were rendered with a custom shader plug-in. All of the code I wrote was based on John Walker's cietoppm.c Netpbm extension. The text was added in Photoshop. |
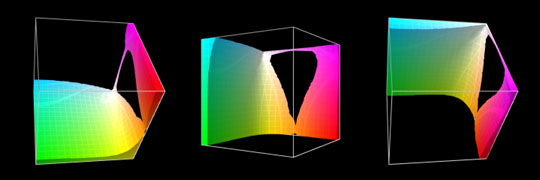
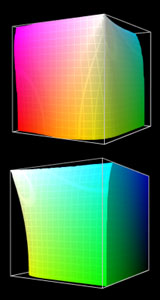 Both color television and computer graphics use red,
green and blue primary colors. The RGB color space (the set of all possible combinations
of red, green and blue) can be represented in 3D by assigning one of the primaries to each
Cartesian axis. The result is a color cube. Both color television and computer graphics use red,
green and blue primary colors. The RGB color space (the set of all possible combinations
of red, green and blue) can be represented in 3D by assigning one of the primaries to each
Cartesian axis. The result is a color cube.Traditional analog color television signals don't encode RGB levels directly. NTSC, the encoding used in the United States, transforms RGB into YIQ. Y contains the same information as a black-and-white signal, while I and Q carry the color (chroma) information, minus the intensity (luminance) encoded by Y. Mathematically, NTSC encoding is lossless, but real TV signals are subject to limitations that restrict the range of RGB colors that can be encoded. When plotted in RGB space, the colors allowed by NTSC form a Salvador Dali color cube with faces and corners eroded into flowing surfaces. This is one of the artifacts of analog encoding that thankfully will be left behind in the switch to digital TV. Another way to look at this is by plotting the colors, described as "hot,"
that aren't allowed by NTSC. The most significant deficits are near fully saturated
yellow and cyan, but problems also occur at full red and green. Source:
|
How it was done The objects are isosurfaces of constant "heat index," a metric I contrived that combines the composite and chroma IRE levels. The coloring was done using a simple custom shader, with grid lines added by applying the Grid procedural in the Diffuse channel. |